By: Colin Courtney Mustaphi and Esther Githumbi
July 16, 2014
X-Ray Fluorescence (XRF) is a technique that yields detailed information on the geochemistry of sediment cores and can be useful for characterising depositional environments and for palaeoenvironmental interpretations. The XRF analysis was performed at the Department of Geography and Earth Sciences at Aberystwyth University in Wales, UK, with help from Dr. Henry Lamb.
The Itrax® X-Ray Fluorescence core scanner was used on sediments collected from Nyabuiyabui Swamp, Eastern Mau, Kenya, and will complement additional analyses investigating the land cover changes at the site throughout the Holocene. Additional information about Nyabuiyabui Swamp can be found in a REAL report published earlier in 2014.
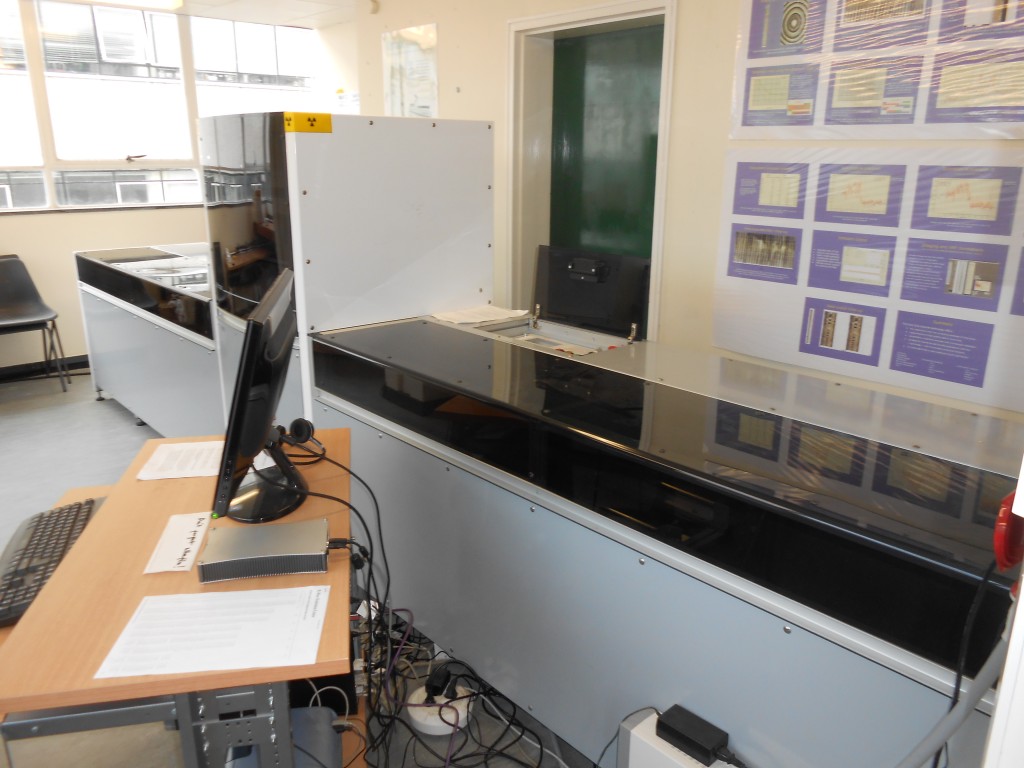
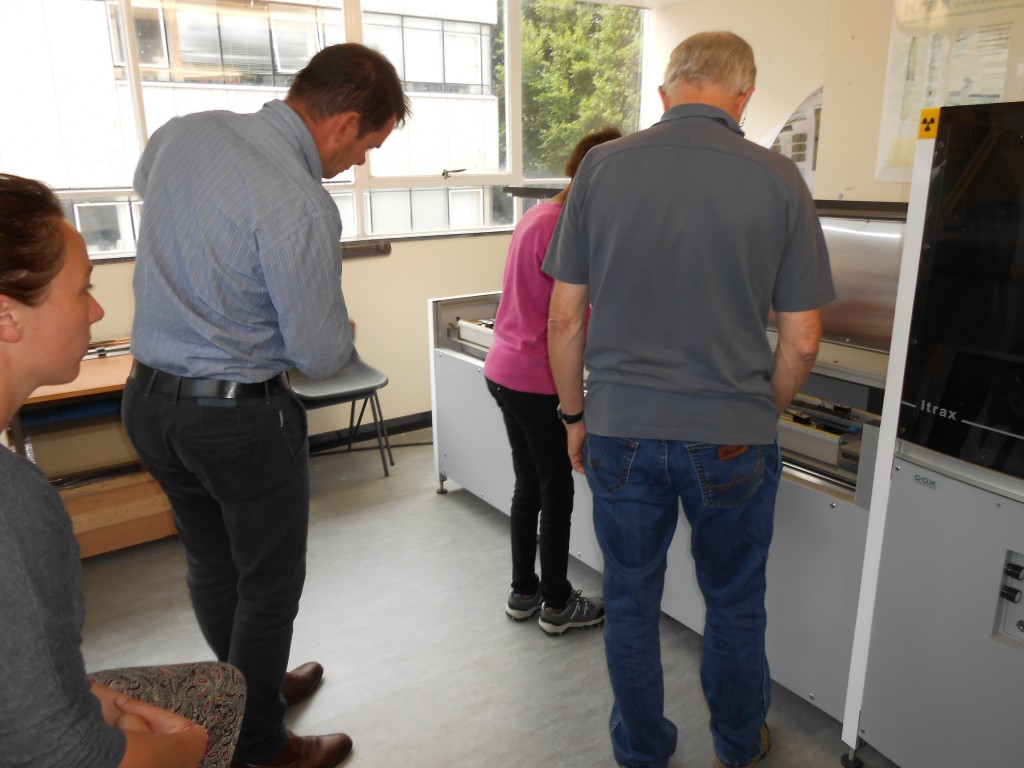
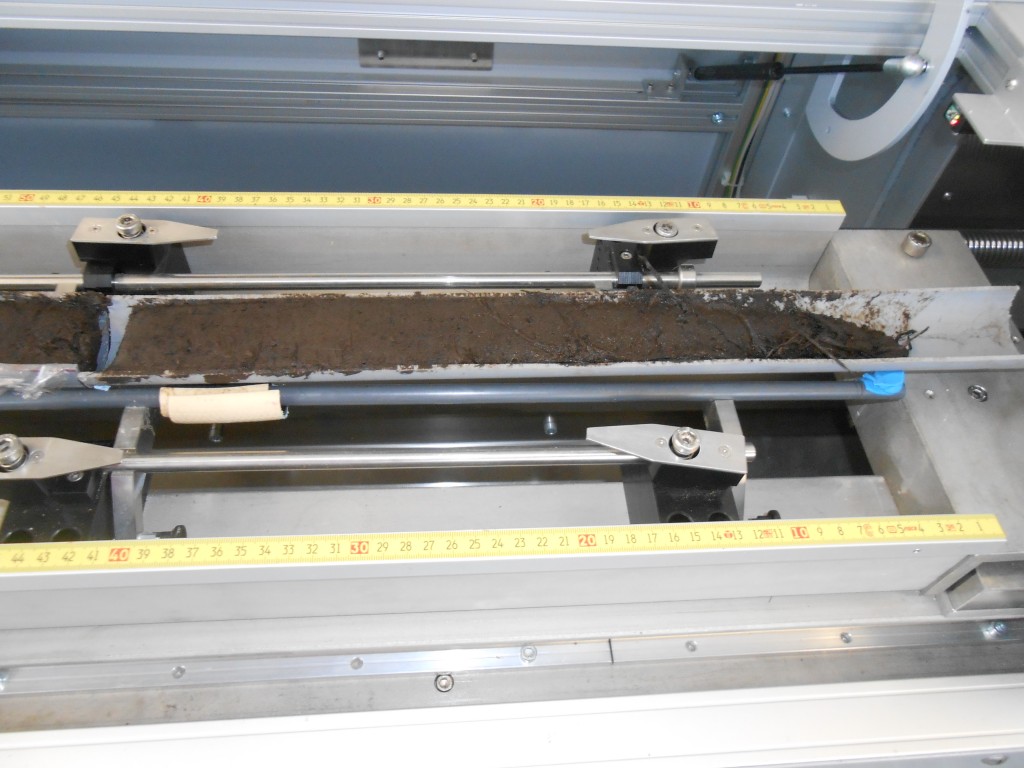
The Aberystwyth University XRF Core Scanner for the rapid chemical and density analysis of sediment cores.
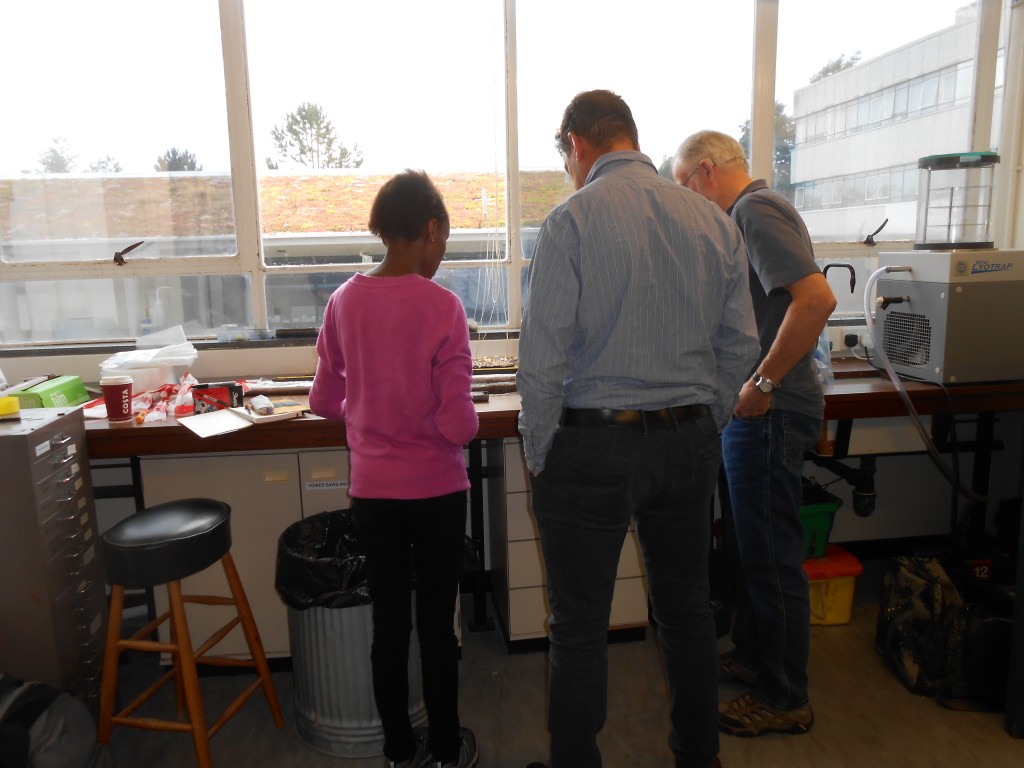
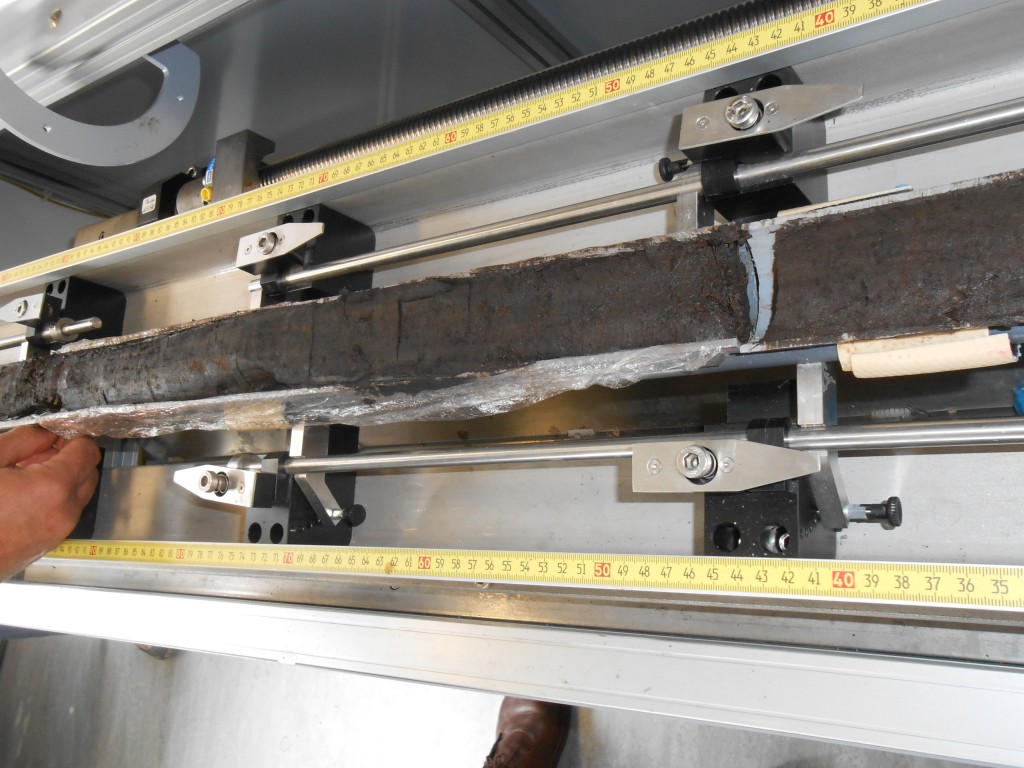
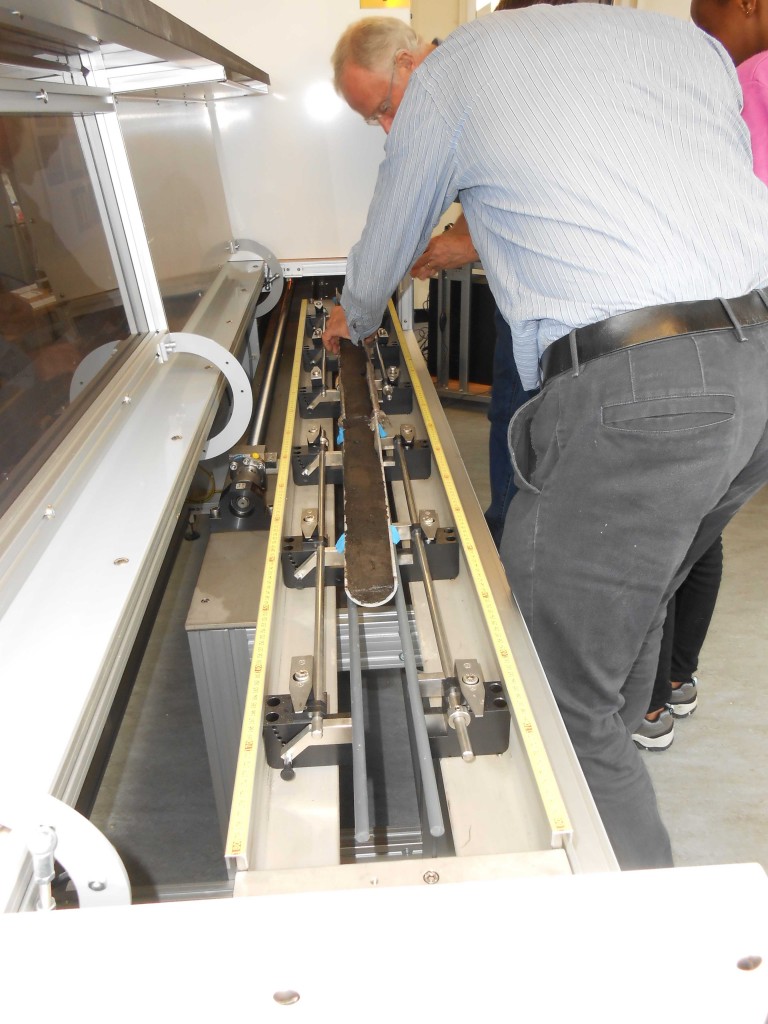
Esther Githumbi, Rob Marchant and Henry Lamb, preparing Nyabuiyabui Swamp sediment cores for XRF scanning.
Photographs by Colin Courtney Mustaphi, July 14, 2014
USING THE ITRAX CORE SCANNER AT ABERYSTWYTH
For those intending to use an Itrax core scanner, they should make themselves familiar with the Cox Analytical Itrax manuals. Data obtained is analysed using Corescanner Navigator, Q-Spec and Redicore.
The time required to collect XRF elemental profiles depends on resolution and count time for example if collection of major and minor element profiles (Si, S, Cl, K, Ca, Ti, Fe, As, Pb, Mn, Zn, Br, Rb, Sr, and Zr) would take 16 hours for a 1m core at 200µm intervals and a 10 second count time.
The Itrax provides a high resolution surface scan image, an elemental profile and a magnetic susceptibility profile. There are two tubes that can be used with the Itrax scanner, the Molybdenum (Mb) tube for heavier elements and the Chromium (Cr) tube for lighter elements. Aluminium is the lightest element that can be detected by the Itrax scanner.
PROCEDURE (Summary for use of Itrax scanner always consult a manual)
Work details are recorded in the Core Scanner Log at the end of the scan session.
Turn the water inflow tap on.
Turn the Seifert HV power supply key to standby. Turn the key on, select appropriate warm up time for the lamp.
Put the cleaned core into the sample holder with the top right aligned at zero and not the core length.
Start the Core Scanner Navigator and confirm tube to be used Mo or Cr.
(Note required all the time) check that the slits are open every time, set radiographic parameters and from the Windows menu show line camera signal it should be at 24000. When achieved hide camera signal.
SURFACE SCAN
Enter the core length and core width, ensure the surface is smooth.
Select the start point and start scan.
RADIOGRAPHIC AND XRF SCAN
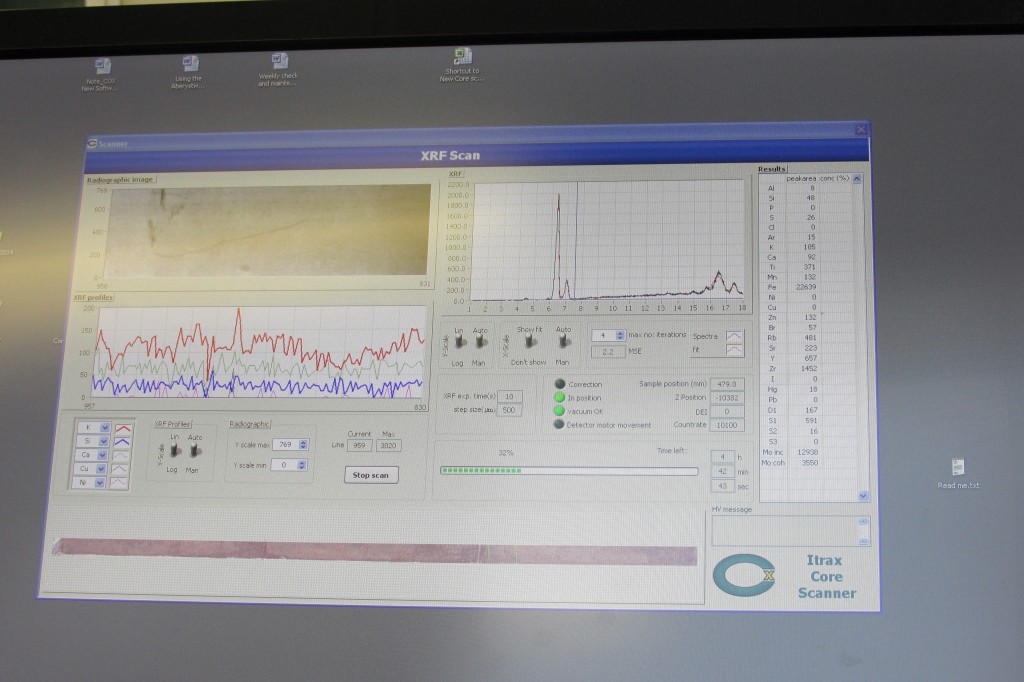
Use the motor buttons to move to a representative part of the core and set the radiographic parameters. Then set the XRF parameters which open the Q-Spec program. Select your settings and one can us previous settings already loaded. Press start.
Fine tune detector parameters to minimise the MSE value and match the actual and fitted spectra. Exit Q-Spec and return to CSN.
Move the core home, cover with ultra-film to prevent drying since the CSN takes a long time.
Record primary signal and start scan, this navigates to where data should be saved and one can adjust resolution and time parameters. Check turn down HV.
Press ok to start scan, CSN enters scanning mode first showing radiography acquisition and later the XRF data.
MAGNETIC SUSCEPTIBILTY
Magnetic susceptibility is always carried out after the main XRF scan as the magnetic sensor touches the core surface and may alter surface profile.
Use the motor buttons to move to a representative part of the core and set the radiographic parameters.
Go home and start.
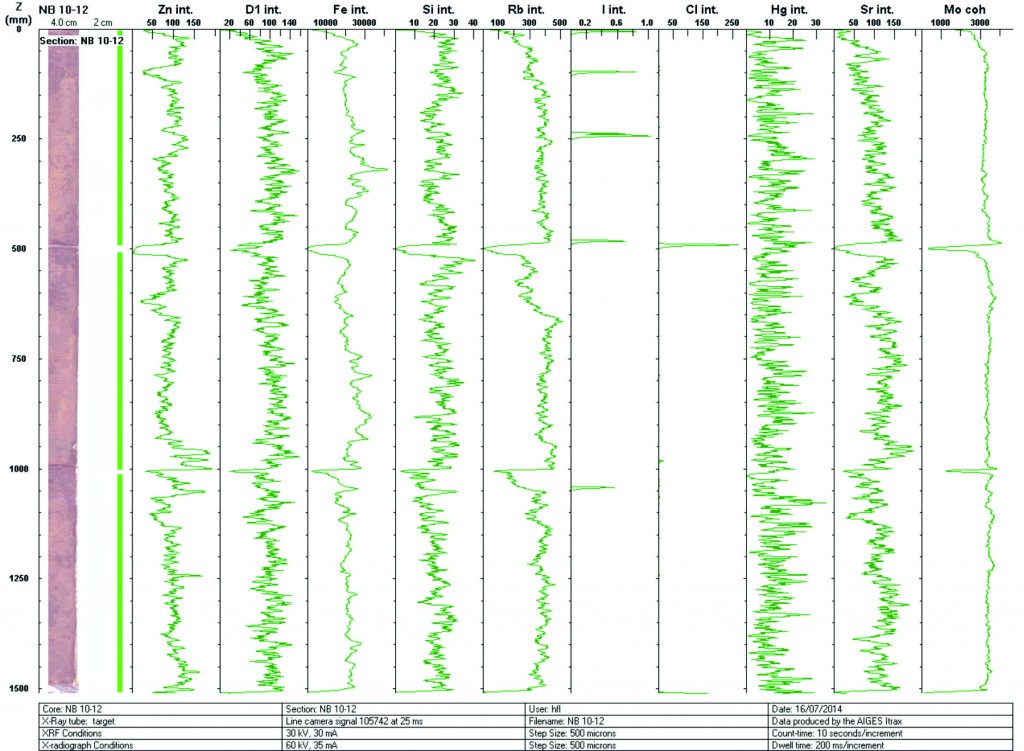
Example of an elemental profile.
